Power BI training: from data literacy and data modeling to strategic reporting in finance
26 November 2025Finance teams today have access to an abundance of data. Yet in practice, this data is often scattered across different systems and departments. Without a clear data strategy and reliable data management processes, reporting remains a time-consuming and error-prone task. Many organizations still work with a maze of Excel files, where definitions and KPIs differ per department. This leads to inefficient processes and frustration, especially at management level. Power BI offers a solution, but only if you know how to truly use the tool, beyond fancy visuals.
- Power BI training helps finance professionals use data strategically, not just visualize it.
- A strong organizational data strategy combined with thoughtful data modeling and governance in Power BI is crucial for reliable reporting.
- TriFinance offers practical training and coaching tailored to the challenges of data-driven finance.
“Many people keep thinking in Excel and build their reports the same way, but in Power BI. The result? Beautiful visuals, but few insights. That way, you miss the real added value of the platform,” says Nico De Neve, Project Specialist Data & Analytics and Power BI trainer at TriFinance. The key lies in training and understanding how to structure, model, and manage data before diving into visualizations. This turns Power BI into a true lever for transformation, enabling stronger data strategies, more efficient processes, and ultimately better decision-making.
Data in finance: abundant but poorly structured
In many organizations, you see a fragmented landscape in terms of data maturity. Some departments are advanced in data analysis, others have not even started. Even within one team, differences in data skills among employees can be significant. Data is often locked in silos, and collaboration between finance and IT is not always optimal.
Without clear agreements on data management, content ownership, master data, and KPI definitions, reporting remains manual and error-prone. This leads to frustration, especially at management level. A well-organized data strategy is no longer a luxury.
The power of a data model in Power BI
A strong data model is the backbone of any reliable reporting. Without this foundation, Power BI is just a visual layer on top of a weak structure.
Data modeling in Power BI ensures tables are logically connected, KPIs are calculated correctly, and analyses are trustworthy.
A solid data model is essential in Power BI. Without it, you may visualize data, but you don’t know if it’s correct.
Nico De Neve, Project Specialist Data & Analytics and Power BI trainer
In our Power BI training, we always start with the data model. We explain how to build a Power BI tabular model following best practices, define relationships, and avoid errors. Only then do we move on to DAX (Data Analysis Expressions, the formula language in Power BI), visualizations, and report sharing.
Power BI as a game-changer for finance
Power BI training offers much more than practical tips for creating visualizations. The platform forces organizations to structure processes, manage access rights, and improve data quality. For finance, this means:
- Automated reporting: fewer manual tasks, fewer errors
- Governance and security: control over who sees what and when
- Faster decision-making: data is available sooner, analyses start earlier
When doubts about data quality are eliminated and less time is lost on manual data handling, more time remains for meaningful analysis that truly drives the business forward. This makes Power BI implementation a driving force behind transformation, not only in finance but across the entire organization.
“Power BI is accessible enough for business users yet powerful enough to generate strategic insights,” says Maarten Lauwaert, Leader Management Information & Systems at TriFinance. “Previously, BI was entirely in IT’s hands, from data models to visualizations. Today, finance is increasingly in the driver’s seat. Thanks to Power BI, controllers and finance managers can build reports, shape models, and respond faster to business questions. This creates more ownership, more speed, and more impact.”
For controlling managers, traceability and reliability of figures are decisive advantages. Power BI offers test and production environments, version control, and usage statistics; features that Excel lacks. In addition, Power BI enables work with centralized data models, where definitions and calculations are established once. This creates a ‘single source of truth’ on which multiple reports can be built. It reduces errors, increases the consistency of reporting, and fosters greater ownership within the organization.
New skills for the finance team
The shift toward data-driven finance requires new skills within finance teams, not only to work with Power BI but also to ask the right questions to IT, data engineers, and business stakeholders. A basic understanding of data engineering and data science, such as how data is collected, transformed, and made available, helps finance professionals collaborate more effectively with technical teams. At the same time, knowledge of data management is essential to organize data quality, definitions, and access rights properly. Collaboration between finance, IT, and data teams becomes a critical success factor in data & analytics. Only when these disciplines understand and complement each other can they generate reliable insights that drive the business forward.
The role of training in successful Power BI adoption
Power BI is widely available in organizations. Implementing the tool and building initial reports is quick. But the gap between usage and strategic insight is often large. TriFinance bridges this gap with Power BI trainings that help finance professionals not only use the tool but also understand it as part of a broader data strategy.
Our Power BI trainings are built around four pillars
- Data model and dimensional modeling
A solid data model is the foundation of any reliable reporting. Participants learn how to logically connect tables, define relationships, and avoid errors. Dimensional modeling is essential in data analysis and reporting, whether you use Power BI, Excel, or another platform. - DAX: the language of calculations
Once the model is in place, participants learn to create KPIs and measures using DAX (Data Analysis Expressions). DAX is powerful but requires insight into how your data is structured. A good model makes DAX simpler and more efficient. - Visualization: from data to insight
Visualizations are more than charts. They must convey the right message, tailored to the end user. The training teaches how to build clear visualizations and reports: no overload of figures, but clear visuals with drill-down options for detailed analysis. - Power BI Service: sharing and securing
Sharing reports within the organization requires governance. Who can see what? How do you restrict data by department? How do you organize test and production environments? The training provides insight into these crucial aspects of Power BI governance.
“Based on these four pillars, we offer trainings in different modules and levels, tailored to participants’ specific needs,” says Anke Paelman, Senior Project Consultant and Power BI trainer at TriFinance. “We start from real-life cases and adapt the content based on participants’ questions. This makes every training relevant and immediately applicable.”
We offer trainings in different modules and levels, tailored to the specific needs of the participants.
Anke Paelman, Senior Project Consultant Data & Analytics and Power BI trainer
What makes TriFinance Power BI training unique?
Finance professionals do not need generic software training, they need insights applicable to their daily reality. How do you structure data for reliable reporting? How do you collaborate with IT? How do you organize governance around reports?
TriFinance offers Microsoft Power BI training based on concrete business questions and practical experience, so finance teams learn not only what is possible but also how to apply it.
1. Learn from Power BI experts
Our trainers are consultants who work with Power BI daily in diverse projects. They understand the challenges of controlling, reporting, and data quality from the inside and can start from realistic use cases and respond to concrete questions.
2. Case-based and interactive
Every training starts from real-life situations. Participants are encouraged to bring their own use cases, ensuring maximum relevance to their work environment.
3. Blended learning: training, e-learning, and coaching
In addition to classroom training, TriFinance provides access to the Datacamp e-learning platform, allowing participants to deepen their knowledge at their own pace. For complex business challenges, we also offer Power BI coaching: one-on-one guidance from an expert who helps design the best approach for your organization.
4. Focus on governance and sustainable implementation
Power BI is powerful, but without clear agreements on data usage, version control, and report structure, it can quickly turn into ‘Power BI spaghetti’. TriFinance helps organizations implement Power BI professionally, with attention to governance, security, and scalability.
5. Flexible formats: open and in-house trainings
Whether you want to join as an individual or train an entire team, TriFinance offers both open trainings and in-house programs.
“Our approach is not one size fits all,” says Nico. “We start from the business context and work together to build solutions that truly work. That is the essence of our Do-How approach: not only knowing how it should be done, but actually doing it.”
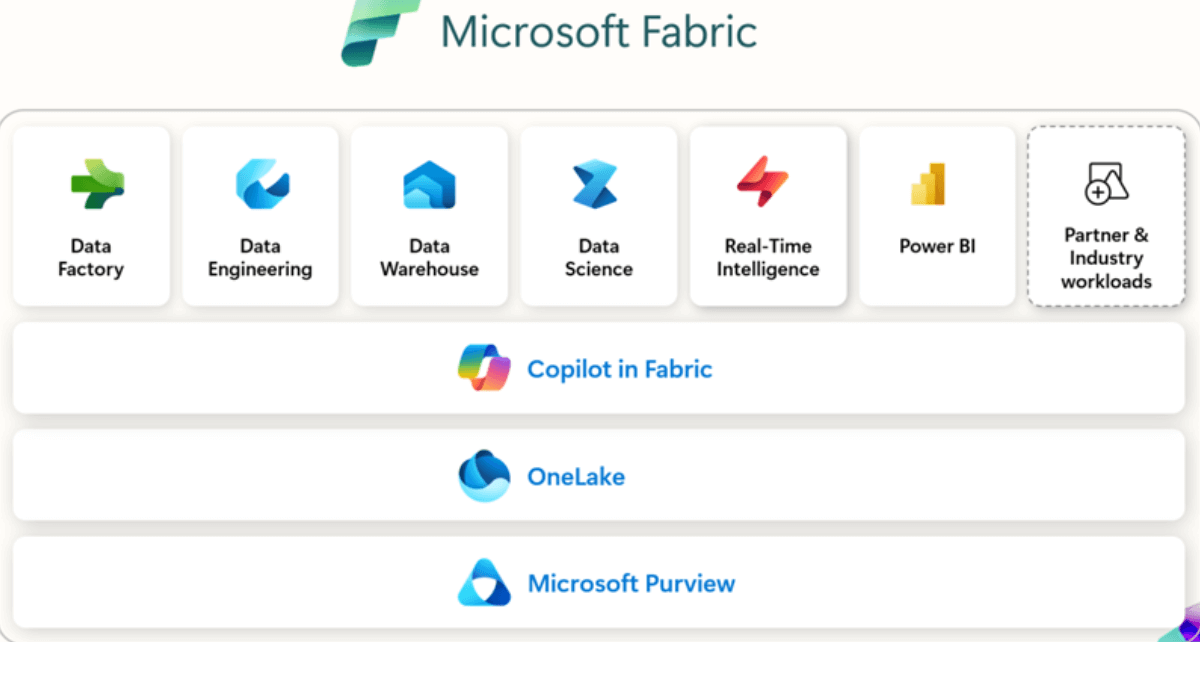
Microsoft Fabric: the next step in data-driven finance
Power BI is no longer a standalone tool. With the introduction of Microsoft Fabric, the platform evolves into a full-fledged analytics ecosystem, integrating data ingestion, modeling, visualization, and even advanced analytics in one environment. For finance professionals, this marks a major shift: from reporting tool to strategic platform for data-driven decision-making, with advanced capabilities for AI in financial reporting.
“Power BI as we knew it no longer exists,” says Maarten Lauwaert. “It is now part of Fabric, which brings all components of a data platform together in one integrated environment.”
Fabric gives finance teams access to central data sources, low code data integration, and greater control over data quality and governance. The platform makes it possible to set up analyses without constantly relying on IT, while collaboration with technical teams becomes easier. The boundary between business and IT continues to blur, which further increases the importance of data engineering skills and data governance within finance teams.
Microsoft Fabric brings all components of a data platform together in one integrated environment.
Maarten Lauwaert, Leader Management Information & Systems
From reporting to strategic data usage in finance with Microsoft Fabric and Power BI
The evolution from Power BI to Microsoft Fabric marks a turning point. Where finance previously consumed what IT delivered, it now has the tools and the responsibility to steer data usage itself. This requires more than technical skills. It demands strategic insight, collaboration, and ownership.
Power BI training in this context is not a standalone course but a lever for transformation. It helps finance professionals not only visualize data but also understand, structure, and use it strategically. Reporting becomes more than an obligation. It becomes a driver for better decision making and faster action.
“Thanks to Power BI and Fabric, finance professionals can now collect and structure data themselves, build reports, design models, and respond to business questions more quickly,” says Nico. “This creates more ownership, more speed, and more impact.”
Conclusion: Power BI training as a strategic lever for modern finance
In an environment where speed, transparency, and data quality are crucial, simply using Power BI is not enough. The real added value lies in using the platform strategically as a lever for better decision making, more efficient processes, and greater ownership within finance. This requires more than technical knowledge. It calls for insight into data modeling, governance, and cross departmental collaboration.
Power BI training is therefore not an operational afterthought but a strategic investment. Not just to keep up, but to enable the finance function to shape how data is used, shared, and interpreted across the organization.
Do you want your finance team to gain more control over data, reporting, and decision making?
Start not with Power BI as a tool but with the fundamentals: data modeling, governance, and collaboration. TriFinance helps you build that foundation through Power BI training, coaching, and pragmatic support tailored to your business context.
FAQs about Power BI training for finance professionals
- What will you learn in a Power BI training for finance professionals?
You will learn how to build reliable reports based on a robust data model (dimensional modeling), create calculations with DAX, design visualizations, and share reports within a governance structure. The focus is on practical insights for real use cases in controlling and finance. - Why is dimensional modeling so important in Power BI?Dimensional modeling ensures your data is logically structured and KPIs are calculated correctly. Without a good model, you risk incorrect insights, even if your visualizations look good.
- What is the difference between Power BI and Microsoft Fabric?
Power BI is a reporting tool. Microsoft Fabric is a scalable analytics platform that integrates Power BI with solutions for data integration, storage, advanced analytics, and governance. It enables companies to manage the entire data chain according to their maturity level. - What makes TriFinance’s Power BI training unique?
TriFinance starts from the business context. Our trainers are consultants with hands-on experience in finance and data & analytics. The trainings are case-based, interactive, and can be combined with e-learning in Datacamp and tailored coaching. - How does Power BI support strategic decision-making in finance?
Power BI accelerates reporting, improves data reliability, and enables governance. This allows finance teams to analyze and advise faster, strengthening their role as strategic business partners.